Rental Affordability Fell in 82% of U.S. Metros, MBA Research Finds
A new MBA RIHA study finds renters lost the equivalent of $256 a year in income on average, and that up to half of rising rent spending reflects better housing.
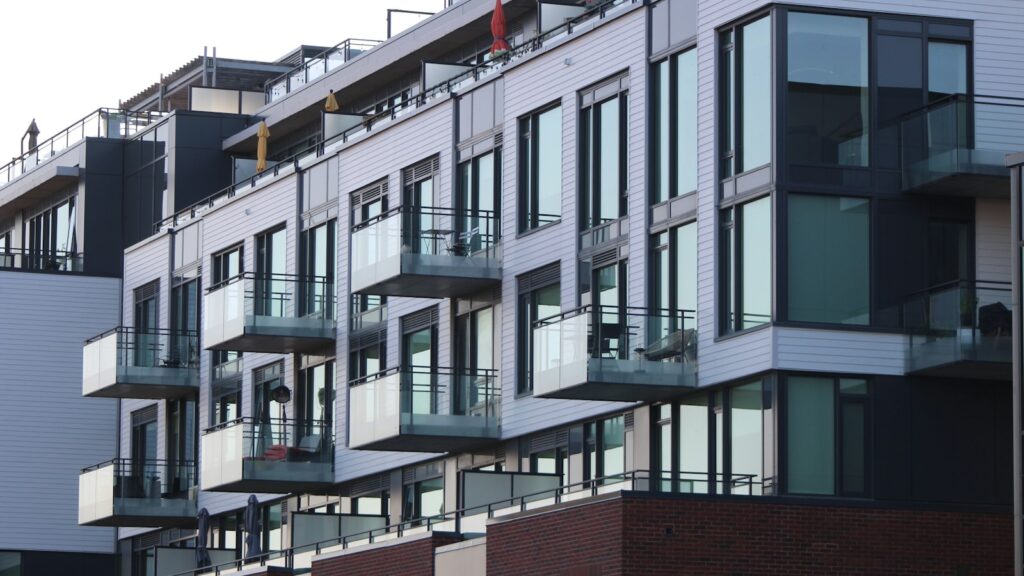
- The study: a report from the Mortgage Bankers Association’s Research Institute for Housing America (RIHA), released November 3, 2026, found rental affordability fell in 232 of 282 U.S. metro areas (82%) between 2014 and 2023.
- The cost: on average, the decline was like losing $256 of income a year per renter household, after adjusting for housing quality.
- The twist: as much as half of the rise in rent spending was linked to better housing, not just higher prices.
- Range: Mount Vernon-Anacortes, WA, had the biggest decline (about $1,212 a year); Mankato, MN, improved the most (about $964 a year).
Ask any renter if rent has gotten more expensive and you’ll get an eye roll. A new study agrees, mostly, but adds an interesting wrinkle: part of what renters pay more for is a nicer place. The report, Housing Demand and the Decline in Rental Housing Affordability by Syracuse University economist Gary Engelhardt, tries to separate “paying more for the same thing” from “paying more for something better.” Here’s what it found and what it means if you’re deciding whether to keep renting or start shopping for a mortgage.
What the study measured
Most affordability headlines use simple ratios, like rent as a share of income or the percentage of renters spending more than 30% of income on housing. Those are useful, but they can’t tell whether rent went up because the same apartment got pricier or because renters moved into bigger, newer or better-equipped homes.
Using American Community Survey data from 2014 to 2023, the study built a new metro-level index that adjusts for housing quality and size, separates supply and demand forces, and accounts for how much housing people choose as their incomes change.
The key findings
| Finding | Number |
|---|---|
| Metros where rental affordability declined | 232 of 282 (82%) |
| Metros where it improved | 50 |
| Average annual loss per renter household | about $256 |
| Share of rent-spending growth tied to quality | up to about half |
| Largest decline: Mount Vernon-Anacortes, WA | about $1,212 a year |
| Largest improvement: Mankato, MN | about $964 a year |
Source: MBA Research Institute for Housing America (Nov 3, 2026). Losses were generally larger in coastal and major metro areas.
Put $256 a year in perspective
$256 a year works out to about $21 a month on average. That sounds small, but it’s an average across hundreds of metros. In the hardest-hit area, the loss of about $1,212 a year is roughly $101 a month. And this measure is adjusted for quality, so it’s the “pure” squeeze after giving credit for nicer housing.
Rent or buy right now?
The study covers renters through 2023, but plenty of renters today are asking the next question: should I buy instead? With the 30-year fixed rate averaging 7.18% in Freddie Mac’s November 5 survey, owning is expensive too.
Try your own numbers in the rent vs. buy calculator, then check what price range fits with the home affordability calculator.
Smart moves for renters who want to buy
- Build the down payment in stages. Check whether you qualify for down payment assistance where you live.
- Protect your credit. On-time rent may help with some newer credit scoring models; our credit score guide explains what lenders look at.
- Consider low-down-payment loans. FHA loans allow as little as 3.5% down with a qualifying score; read the FHA requirements.
- Use the slow market. Homes are sitting longer this fall, which can mean room to negotiate. Start with the first-time home buyer checklist.
What to watch next
- Nov 6: October jobs report, a key driver of wage growth and rates.
- Nov 10: October CPI. Shelter costs (rent and owners’ equivalent rent) are the largest piece of core inflation.
- Thursdays: Freddie Mac’s weekly mortgage rate survey; see our mortgage rate forecast for the outlook.
FAQ
Has rent become less affordable?
In most places, yes. The MBA RIHA study found rental affordability declined in 82% of U.S. metro areas between 2014 and 2023.
Why does housing quality matter for affordability?
If renters pay more because they’re getting bigger or better homes, that’s not the same as paying more for the same home. The study found up to half of rising rent spending was tied to quality.
Which metro became the least affordable for renters?
Mount Vernon-Anacortes, Washington, saw the largest decline, equal to about $1,212 in lost income per renter household per year.
Is it cheaper to rent or buy right now?
It depends on local rents, prices and how long you’ll stay. At rates above 7%, renting is often cheaper month to month, while buying builds equity over time.
Sources: Mortgage Bankers Association, Research Institute for Housing America, “Housing Demand and the Decline in Rental Housing Affordability” (Nov 3, 2026); Freddie Mac Primary Mortgage Market Survey (Nov 5, 2026); Realtor.com October 2026 Monthly Housing Report; U.S. Bureau of Labor Statistics release schedule. Payment examples computed by Keys & Coffee. This article is general education, not financial advice. Keys & Coffee is not a lender.

Written by
Shivam Kaushik· IMSHIVA
Founder & Director, QuibbleTech Solutions Pvt Ltd · Editor, Keys & Coffee
Shivam Kaushik is the founder of QuibbleTech Solutions Pvt Ltd and the editor of Keys & Coffee. He is not a licensed loan officer or financial adviser. Every guide here is written in plain English and checked against official sources such as the CFPB, HUD, Fannie Mae, Freddie Mac and the Federal Reserve. For advice on your own loan, talk to a licensed lender.
Keys & Coffee is an independent education site. We are not a lender or mortgage broker, we do not take loan applications or payments, and nothing here is financial advice. This site is not affiliated with Axia Home Loans, Axia Financial, LLC, or Planet Home Lending. Rates and rules change often — always confirm details with a licensed loan officer and check any lender on the NMLS Consumer Access site.
Keep reading
Realtor.com October Report: Inventory Up 7.4% as New Listings Drop 7.5%
Active listings rose to 1.18 million in October 2026 while new listings and contract signings fell. Here's what the slower market means…
How Long Does It Take to Close on a House? The Timeline, the Delays and How to Speed It Up
Your offer got accepted. Now, when do you get the keys? Here is the usual closing timeline, the sneaky things that slow…
Home Appraisal Explained: What Appraisers Check and What to Do If It Comes In Low
A stranger with a tape measure decides if your dream home is worth the price. Here is what appraisers check, what it…